The transferable tax credit market is maturing rapidly. Crux’s 2024 Transferable Tax Credit Market Intelligence Report found that the 2024 tax credit transfer market more than tripled 2023 transaction volume to total nearly $30 billion.
2024 was the first full year of transferability, and trends are starting to emerge regarding tax credit pricing, supply, and demand. Timing has important implications for the tax credit market. Tax credit buyers must make quarterly estimated payments and prefer to coincide their payment for a tax credit with those payment dates, which can bring an influx of buyers to the tax credit market in the back half of the year. Similarly, the supply of tax credits is relatively fixed — a function of the tax credit–generating activities that occur in a year — and most buyers today are not carrying their tax credit purchases forward or backward to future or past years.
As a result, most tax credits are generally sold within the year, and at least before the final annual tax filing deadline has passed. Competition and pricing evolve over the course of the year as buyers scoop up tax credits. Tax credit buyers may want to consider these trends as they consider their 2025 tax credit strategies — there could be benefits to acting earlier in the year.
Get our latest insights and favorite reads on the transferable tax credit market in your inbox.
Crux maintains a dynamic tax credit marketplace platform and observed some seasonality in tax credit pricing over the course of 2024. These observations led to the preparation of the industry’s first seasonal pricing curves. Seasonality is a common characteristic for commodities or other asset classes where supply and demand fluctuate according to a seasonal pattern over the course of a year.
The observed seasonal factors for investment tax credits (ITCs) and production tax credits (PTCs) do not constitute a forecast, and many macroeconomic factors could influence pricing in the future. These factors could exaggerate the effect of seasonal supply and demand trends, or could overrule them entirely.
Crux saw a trend in seasonal ITC pricing. It’s important to note that seasonal factors are not a price prediction but rather show the variance from a mean value (depicted as a factor either greater than or less than one). The data suggests that market seasonality varies by approximately 2.5% over the course of a year.
Applying these factors suggests that a tax credit that would, on average, price at 92.0 cents might attract bids between 90.8 cents and up to 93.5 cents over the course of a year.
ITC approximate seasonality trend by month (factor, average = 1.00)

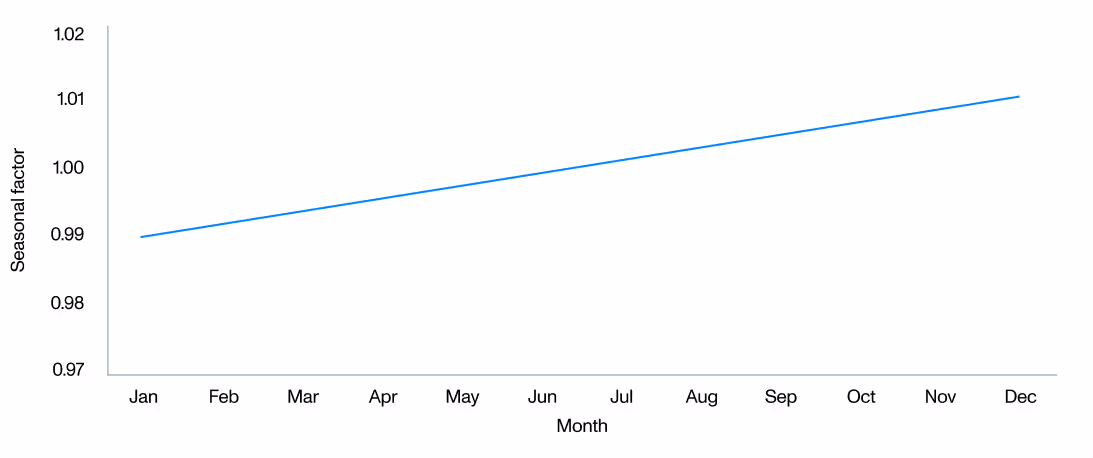
PTCs do not appear to exhibit a seasonal trend in the same manner as ITC deals. The data indicates that the average value of a PTC rises modestly and linearly over the course of a year, increasing by about 2% from January to December. One interpretation of this result may be that the nature of how PTCs are generated — accumulating over time as the facility produces electricity or manufactured goods, and often selling quarterly — allows the buyer and seller to more seamlessly align payment with the buyer’s tax filing dates and incorporate PTC purchases into their tax strategy.
PTC approximate seasonality trend by month (factor, average = 1.00)
Download the report for more insights on the 2024 tax credit market
Seasonality can illustrate a trend, but may not predict how an individual tax credit will behave in the market. In 2024, demand and bid activity on Crux rose throughout the year. By the fourth quarter, the majority of listed 2024 tax credits had been sold or were actively engaged with a buyer, increasing competition and supporting higher average pricing.
Crux calculated the ratio of demand to supply for traditional 2024 ITCs in 2024 and 1Q2025. In the first and second quarter of 2024, supply exceeded demand with approximately $1 of demand for every $2 or $3 of tax credit supply. Demand rose disproportionate to supply in the second half however, to $1.20–1.54 of demand for every dollar of tax credit supply.
The difference in supply and demand became even more pronounced in the first quarter of 2025. Demand significantly exceeds tax credit supply, with nearly $5 of demand for every dollar of supply.
Ratio of demand to supply by quarter, solar and/or storage ITCs

The overall volume of demand and supply increased through 2024 and into 2025. While supply did increase through 2024, demand grew faster in 2H2024 and onward. At that point, tax credit availability became more constrained.
Total demand and supply by quarter, 2024 solar and/or storage ITCs

Consistent with observations on demand, Crux observed that commercial pricing for tax credits increased with higher market demand. Prices in the first quarter of 2024 averaged around 90.8 cents, ticking down slightly in the second quarter to 90.6 cents. Prices in the third and fourth quarters rose materially, to 92 and 93 cents, respectively. Pricing in the first quarter of 2025 is in line with prices in the fourth quarter of 2024, despite increased demand, suggesting that average pricing plateaus around 93 cents, approximately in line with Crux’s findings that ITCs price around 92.5 cents on average.
Note: Prices are gross and not adjusted for deal size or seller credit quality, which can materially impact market pricing.
Average pricing by quarter, 2024 solar and/or storage ITCs

Demand for 2024 wind and advanced manufacturing PTCs exceeded supply in all quarters of 2024 and into 2025. In early 2024, demand was between $2.30 and $2.80 for every $1.00 of available supply. In the fourth quarter, however, Crux observed $5.70 of demand for every $1.00 of available supply. In early 2025, availability of these PTCs is extremely limited. There is nearly $19 of demand for 2024 PTCs relative to supply.
Ratio of demand to supply by quarter, premium PTCs

Supply did increase substantially in the third quarter, driven principally by new supply of §45X advanced manufacturing PTCs, but the available supply in the first quarter of 2025 is limited. While demand has declined, it remains significantly greater than supply. Other PTCs, including nuclear, are helping to fill some of the gap between supply and demand for 2024 PTCs.
Total demand and supply by quarter, 2024 tax credits

PTC pricing is generally consistent on average across 2024 and into 2025. Pricing did sag from 93.5 cents to 92.4 cents in the second quarter of 2024, but it recovered to 94.0 cents in the third quarter and has remained at that level thereafter.
While pricing is consistent, the bids have become more concentrated around the average. More than 85% of bids on PTCs in 4Q2024 and 1Q2025 are 94 cents or higher, compared to 65% of bids in 1Q2024.
Average pricing by quarter, 2024 PTCs

The data suggests that tax credit buyers who purchase credits earlier in the year can take advantage of wider credit availability and less competition. Entering the market earlier allows a buyer to ensure that they get the credits — both size and type — that they want to satisfy their tax liability, as compared to entering the market later in the year when certain credits may no longer be available and competition is stiffer.
Pricing discounts are also more likely earlier in the year. As the market grows more competitive later in the year, prices increase (in the case of ITCs) or become more concentrated around the upper end of the price range (in the case of PTCs), reducing any possibility of discounts.
With our expert team, leading platform, and the largest network of clean energy developers and manufacturers, Crux makes it easy for tax credit buyers to transact on transferable tax credits tailored to their preferences. Contact us to get started on the Crux platform.